Executions
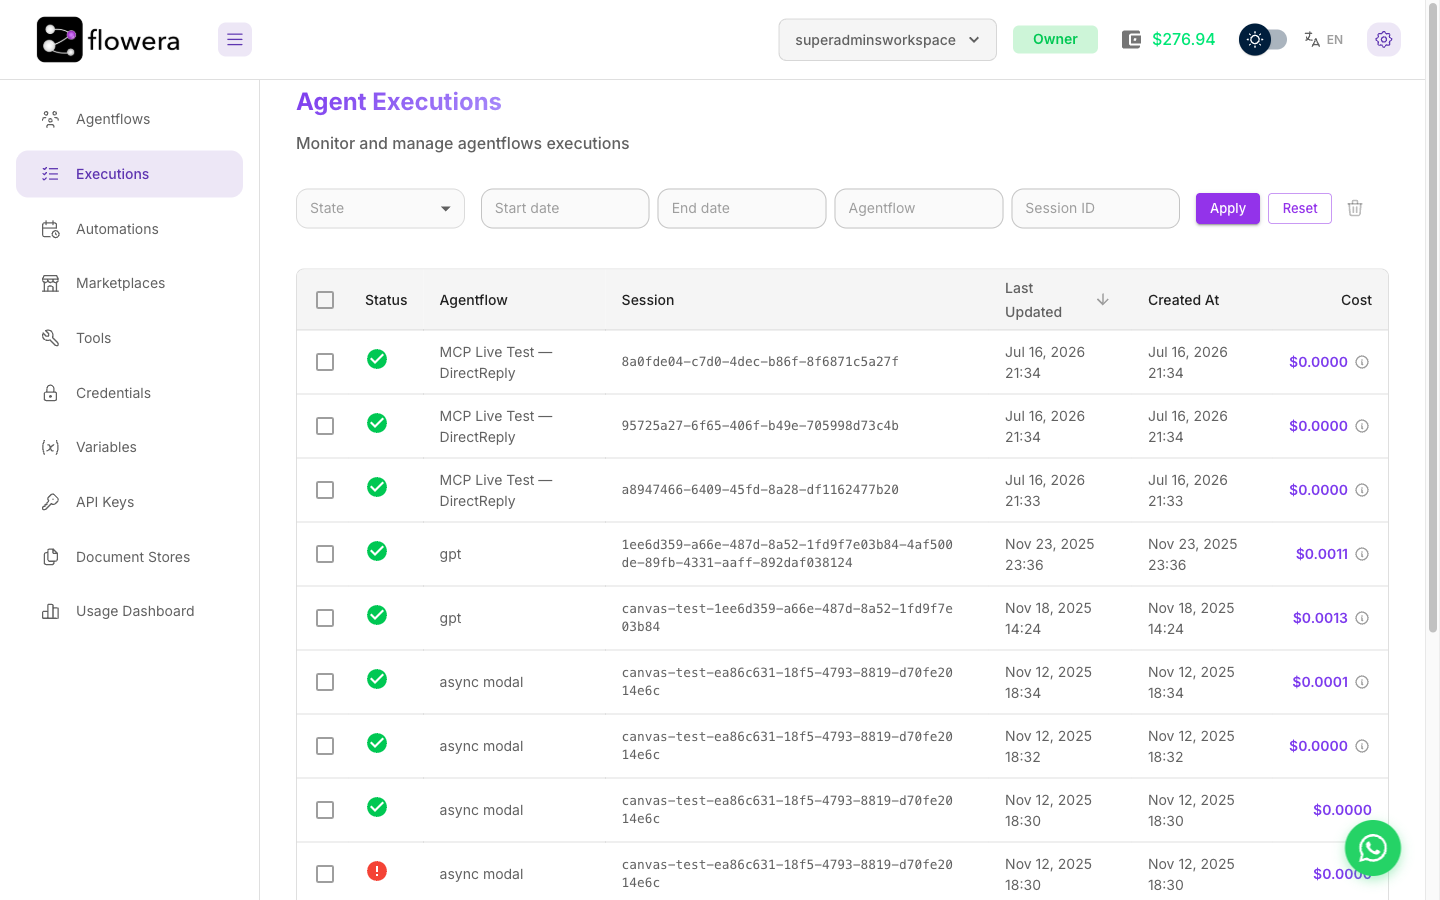
An execution is a single run of your flow — one trip from the trigger through the nodes to the final reply. Every time a customer sends a message, a form is submitted, or a webhook fires, Flowera records an execution that captures which nodes ran, what each one produced, how long it took, and how it ended. Executions are your window into why a flow behaved the way it did, which makes them the first place to look when something goes wrong.
Open the executions list from the flow's canvas header.
Sessions vs. executions
A session is one ongoing conversation; an execution is one run within it. A single session usually contains many executions — one per message the customer sends. Grouping executions by session is what lets you follow a whole conversation while still inspecting each individual run.
A session can even have several executions running at once — for example when a customer fires off three messages before the first reply lands, or a webhook triggers the flow rapidly. This is normal. Flowera keeps each run's data separate while sharing flow state across the conversation.
Execution status
Each execution ends in one of these states:
| Status | Meaning |
|---|---|
| In progress | Still running, or waiting (for a scheduled wait or a human approval) |
| Finished | Completed successfully |
| Error | Something failed during the run |
| Timeout | The run took longer than allowed |
| Stopped | Manually stopped |
| Terminated | Force-stopped by the system |
| Skipped | Not run (for example, a detected duplicate) |
An execution can sit In progress on purpose — a Wait node or a Human Input approval pauses the run until it's time to continue.
Reading the trace
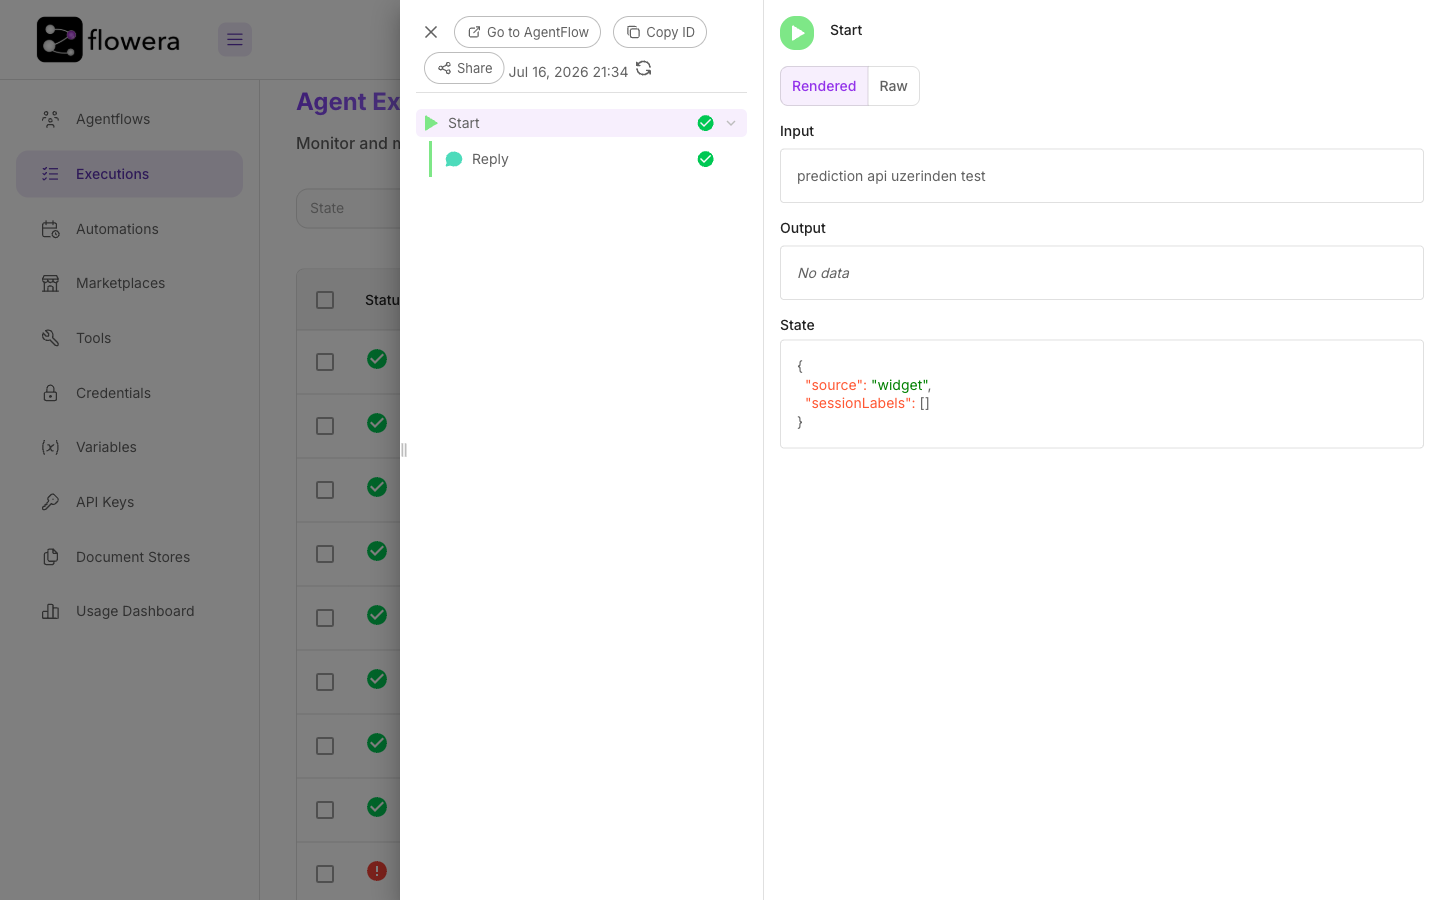
Click an execution to open its detail view. It has two parts:
- Node tree — every node that ran, in order, with a status icon and the flow's branching shown as indentation. This is the path the run actually took through your flow.
- Node details — click any node in the tree to see its inputs and outputs: what it received, what it produced, and (for AI nodes) the model's response. This is where you confirm a node did what you expected.
On a phone, the node list opens first as a full-screen picker so you choose a node, then its details slide in. A small pull tab on the left edge reopens the node list.
Debugging with executions
When a flow misbehaves, the trace tells you exactly where:
- Wrong reply? Open the AI node's output to see what the model actually returned, and check the node feeding it to confirm the inputs were right.
- Flow took the wrong branch? Look at the Condition or Condition Agent node in the tree — the trace shows which branch it chose and why.
- A value came out empty? Walk back up the tree to the node that was supposed to set it, and check that its output matches what later nodes expect.
- Run errored? The node with the error status is where it stopped; its details describe what failed.
Pair executions with View Messages. View Messages shows the customer-facing conversation; the execution behind a message shows the full behind-the-scenes reasoning and every node output that produced it.
Which version ran
A flow changes over time — and an execution records which version of it ran. That matters when you're reading a run from last week against a flow you've edited five times since: without it, the trace shows nodes that no longer exist and hides the ones you just added, and nothing tells you why.
- The execution names the flow's version number at the moment the run started — shown in the
Version column of the list and as a
v5chip in the detail view. Click the chip to open the canvas in a read-only preview of that exact version. - If the run paused at a Wait node and you saved the flow before it continued, the execution also records the version it resumed on. The run itself continues on the current flow, exactly as before — this only makes the change visible instead of silent.
- Runs recorded before versioning was introduced have no version. Flowera keeps history from that point forward rather than guessing backwards.
See Version history for previewing, comparing and restoring versions from the canvas, and Build via MCP for doing the same from an agent.
Why a run can update later
An execution's "last updated" time can change after the conversation appears finished. Flowera occasionally revisits runs — for example to recover a run that was interrupted by a restart — so a run's timestamp may be later than when the customer first triggered it. This is expected and doesn't mean the customer is still waiting.
Related
- How a flow runs — the execution model in depth
- Version history — the version each run executed, and how to get back to it
- View Messages — the customer-facing side of each run
- Flow state — the data shared across a session
- Wait and Human Input — nodes that pause a run