Usage Dashboard
The Usage Dashboard answers the question a pay-as-you-go bill can't: not just how much, but what on.
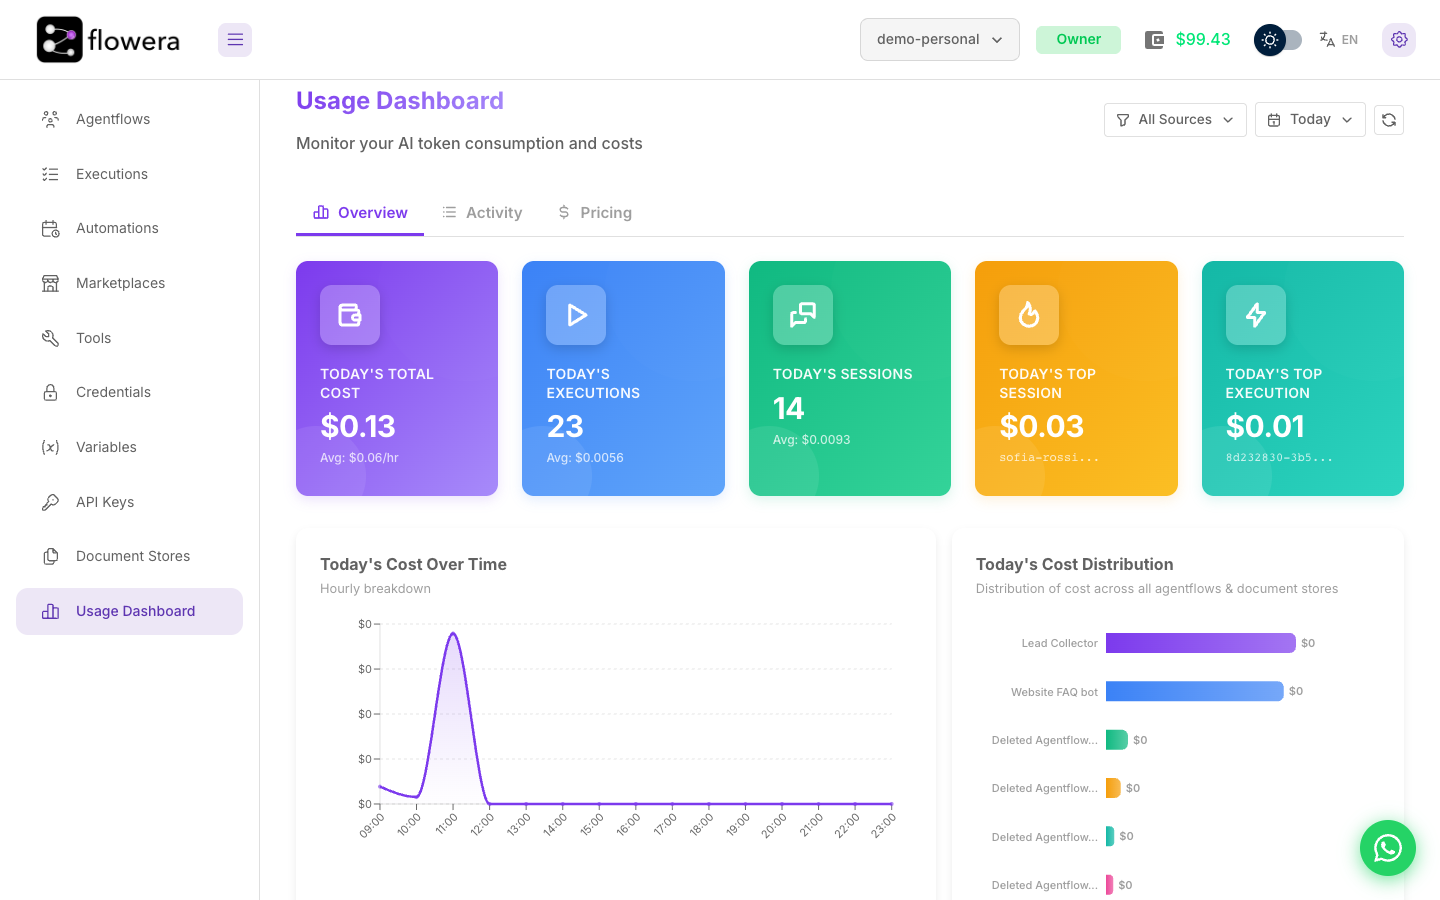
What the dashboard is for
Cost in Flowera is the sum of thousands of small charges. The dashboard aggregates them so you can see which flow, which node, and which conversation actually spent the money.
The questions it's good at:
- Which flow costs the most, and is that the flow doing the most work?
- Did spending change this week, and when exactly?
- Which single conversation was the most expensive, and why?
- Is a document store's embedding cost worth what it returns?
The three tabs
| Tab | What it shows |
|---|---|
| Overview | Summary cards, cost over time, and cost broken down by flow and node |
| Activity | The underlying sessions and executions, as sortable tables |
| Pricing | The fixed fees and the read-only rate card for AI models and paid tools — see Pricing |
Overview tells you where the money went. Activity lets you open the individual runs behind it. Most investigations start on Overview and end in a single execution trace.
Filters apply across the whole dashboard
A time range and a source filter sit above the tabs and apply to everything below, persisting as you switch tabs. See Filters.
The source filter is more useful than it looks: choosing a single flow turns the distribution chart from "cost by flow" into "cost by node within that flow", which is how you find the one expensive step.
How fresh the data is
Effectively live. Costs are aggregated as billing events happen rather than in a nightly batch, so a run that finishes now shows up now.
Two caveats worth knowing:
- A run in flight isn't complete. An execution still running has some of its cost recorded and some not.
- Times follow your browser's time zone. "Today" means today where you are, and a colleague in another zone sees the same data grouped into different days.
Refreshing
The refresh button re-fetches everything currently visible. Each section loads independently, so the page fills in as results arrive rather than waiting for the slowest.
Costs that don't appear here
The dashboard tracks consumption, not money movement. Top-ups, bonuses, and expiring bonus credit never appear — those are in the wallet's transaction history. See Credits & wallet.
If your balance and your usage don't reconcile, that difference is the reason.
Related
- Overview tab — the cards and charts in detail
- Activity tab — sessions and executions
- Filters — what each control changes, and what it doesn't
- Pricing — the rates behind the numbers